This page has been archived on the Web.
Departmental Performance Report 2012–2013
Download as PDF (529 KB)
Table of Contents
Minister's Message

Employee training and education are essential in any major organization. They help make sure staff can meet performance expectations, do their current jobs better, and learn new skills to adapt to new requirements.
Last year, the Canada School of Public Service (the School) continued to reduce the cost of training through budget and personnel reductions and other efficiencies, including growth in online learning offerings. In 2012-13, over 68,000 registered learners made use of online learning materials.
As the minister responsible for the School, I am pleased to present the School's 2012-13 Departmental Performance Report.
Original version signed by:
The Honourable Tony Clement
President of the Treasury Board and Minister for the
Federal Economic Initiative for Northern Ontario
Section I: Organizational Overview
Raison d'être
The Canada School of Public Service (the School) is the common learning service provider for the Public Service of Canada. The School has a legislative mandate to provide a range of learning activities to build individual and organizational capacity and management excellence within the public service.
The School has one strategic goal: to ensure public servants have the common knowledge and leadership and management competencies required to effectively serve Canada and Canadians.
Responsibilities
Established on April 1, 2004, under the Public Service Modernization ActFootnote i and operating under the authority of the Canada School of Public Service ActFootnote ii (CSPS Act), the School's primary responsibility is to provide a wide range of learning opportunities and develop a learning culture within the public service. The School has a direct effect on service to Canadians by contributing to the skills development of public service employees and the effectiveness of public service organizations.
As a departmental corporation, the School is mandated under the CSPS Act to:
- encourage pride and excellence in the public service;
- foster a common sense of purpose, values and traditions in the public service;
- support deputy heads in meeting the learning needs of their organizations; and
- pursue excellence in public management and administration.
The School's program priorities are geared to delivering results in accordance with the Treasury Board's Policy on Learning, Training and Development,Footnote iii which came into effect on January 1, 2006. The Policy highlights the value of learning, with particular emphasis on required training and the importance of creating a learning culture within the public service.
The School supports deputy head accountabilities with respect to leadership and professional development across the public service by identifying organizational needs and designing and delivering high-quality and practical programs that address the key development needs of public service employees.
As a common service organization under the Treasury Board's Common Services PolicyFootnote iv the School's curriculum is designed to support public service accountabilities and leadership competencies and respond to government priorities. As an optional service provider, the School responds to the needs of the public service in the most efficient and effective manner possible.
The School's direction and planning is informed by a committee of deputy ministers appointed by the Clerk of the Privy Council. Established in 2012-13, the Canada School of Public Service Advisory Committee Footnote v provides an ongoing forum for consultation, collaboration and discussion of the School's strategic agenda and emerging public service-wide learning priorities.
Strategic Outcome and Program Alignment Architecture
The School has a single strategic outcome: "Public servants have the common knowledge and the leadership and management competencies they require to fulfil their responsibilities in serving Canadians." The diagram below illustrates the School's complete framework of programs, sub-programs and sub-sub-programs, which contribute to the achievement of the strategic outcome.

Text version
Image of the Canada School of Public Service's Program Alignment Architecture.
The School has a single strategic outcome: Public servants have the common knowledge and the leadership and management competencies they require to fulfil their responsibilities in serving Canadians.
The School has four programs: 1. Foundational Learning; 2. Organizational Leadership Development; 3. Public Sector Management Innovation; and 4. Internal Services.
The sub-programs and sub-sub-programs are as follows:
1.1 Required Training
1.1.1 Orientation to the Public Service
1.1.2 Authority Delegation Training
1.2 Professional Development Training
1.2.1 Functional Communities Programming
1.2.2 Professional Development Programming
1.3 Official Languages Learning
1.3.1 Access to Language Training Services
1.3.2 Language Retention Services
1.4 Online Learning
1.4.1 Online Course Program
1.4.2 Online Collaborative Technology Program
2.1 Leadership Competencies
2.2 Leadership Development Programs
2.3 Leadership Community Building
3.1 Organizational Learning Services
3.2 Innovative Management Practices
4.1 Governance and Management Support
4.1.1 Management and Oversight
4.1.2 Communications
4.1.3 Legal
4.2 Resource Management Services
4.2.1 Human Resource Management
4.2.2 Financial Management
4.2.3 Information Management
4.2.4 Information Technology
4.2.5 Travel and Other Administrative Services
4.3 Asset Management Services
4.3.1 Real Property
4.3.2 Materiel
4.3.3 Acquisition
Organizational Priorities
Organizational Priorities: Strengthening Curriculum. This table presents details on the School priority, Strengthening Curriculum. The first two rows present the Type and Strategic Outcome and Programs for this priority. The third row is the header Summary of Progress. The last row of the table presents details on the summary of progress made towards the priority.
| Priority |
TypeFootnote 1 |
Strategic Outcome and Programs |
| Strengthening Curriculum |
Previously committed to |
Strategic Outcome: Public servants have the common knowledge and the leadership and management competencies they require to fulfil their responsibilities in serving Canadians.
- Program: Foundational Learning
- Program: Organizational Leadership Development
- Program: Public Sector Management Innovation
|
| Summary of Progress |
|
What progress has been made towards this priority?
In 2012-13, the School met its Strengthening Curriculum priority through the following activities:
- In collaboration with its central agency partners, the School advanced the Treasury Board's new Directive on Performance Management Footnote vi through the development of a suite of online performance management tools designed to support related public service-wide competencies.
- The School has played a key role in supporting public service-wide engagement efforts related to Blueprint 2020,Footnote vii a vision for the future of the federal public service. Through its involvement in this transformation initiative, the School is well-aligned to support the new and emerging learning needs of the public service.
- A comprehensive review of the School's learning products, market trends and emerging best practices was undertaken in order to ensure that the organization remains efficient, cost-effective and aligned with the Government of Canada's priorities and the learning needs of the public service.
- The School's Advisory Committee was established to provide the School with a forum for strategic advice, collaboration and discussion of the School's priorities as well as emerging learning and professional development issues.
- In support of the Government of Canada's priority to streamline and modernize the public service, the School delivered learning services designed to equip public service employees with the knowledge and skills necessary to manage current and emerging issues on topics such as workforce management, leading change and business process transformation.
|
Organizational Priorities: Building Partnerships. This table presents details on the School priority, Building Partnerships. The first two rows present the Type and Strategic Outcome and Programs for this priority. The third row is the header Summary of Progress. The last row of the table presents details on the summary of progress made towards the priority.
| Priority |
Type |
Strategic Outcome and Programs |
Building
Partnerships |
Previously
committed to |
Strategic Outcome: Public servants have the common knowledge and the leadership and management competencies they require to fulfil their responsibilities in serving Canadians.
- Program: Foundational Learning
- Program: Organizational Leadership Development
- Program: Public Sector Management Innovation
- Program: Internal Services
|
| Summary of Progress |
|
What progress has been made towards this priority?
In 2012-13, the School met its Building Partnerships priority through the following activities:
- Building on new and existing networks, the School collaborated with departments across the public service, including the Treasury Board of Canada Secretariat, the Office of the Chief Human Resources Officer, the Privy Council Office, the Royal Canadian Mounted Police and Public Safety Canada, to develop learning products designed to meet the current and emerging learning needs of the public service on a range of issues, including performance management, security and change management.
|
Organizational Priorities: Management of Change. This table presents details on the School priority, Management of Change. The first two rows present the Type and Strategic Outcome and Programs for this priority. The third row is the header Summary of Progress. The last row of the table presents details on the summary of progress made towards the priority.
| Priority |
Type |
Strategic Outcome and Programs |
| Management of Change |
Previously
committed to |
Strategic Outcome: Public servants have the common knowledge and the leadership and management competencies they require to fulfil their responsibilities in serving Canadians.
- Program: Foundational Learning
- Program: Organizational Leadership Development
- Program: Public Sector Management Innovation
- Program: Internal Services
|
| Summary of Progress |
|
What progress has been made towards this priority?
In 2012-13, the School met its Management of Change priority through the following activities:
- Following the arrival of a new Deputy Minister/President in October 2012 and the establishment of the School's Advisory Committee, the School initiated preliminary work on its Strategic Directions project. As a result of this project, a five-year strategic plan will be developed based on a comprehensive examination of the School's priorities and extensive consultations with internal and external stakeholders, in order to ensure the organization's continued alignment with the Government of Canada's priorities and the changing learning needs of the public service.
- The School implemented a comprehensive streamlining and consolidation of its services and internal operations in order to realize increased efficiency across the organization. As part of these efforts, the School applied a strategic approach to managing staffing and vacancies, as well as the human resources implications related to ceasing the direct delivery of language training services to the public service.
- The organization managed its transition to a new official languages learning model. With that shift came a renewed focus on developing new learning methodologies; providing language learning plan services on a cost-recovery basis; supporting the availability of quality-assured external providers; and providing online learning products designed to support and maintain the second-language proficiency of public service employees.
|
Risk Analysis
Risk Analysis: Select a risk from the first column and then read to the right for the Risk Response Strategies, the Link to the Program Alignment Architecture and the Link to Organizational Priorities.
| Risk |
Risk Response Strategy |
Link to Program
Alignment Architecture |
Link to Organizational Priorities |
| Relevance of Curriculum and Delivery of Products and Services |
The School operates in a rapidly changing environment which affects the relevance of its existing curriculum as well as the need to respond to the evolving training needs of public service employees.
The 2012-13 Report on Plans and Priorities identified a focus on renewing and updating the School's curriculum in order to be more responsive to client needs and on the development of a costing and pricing model for its products and services.
In 2012-13, the School:
- implemented a streamlined process for the analysis and review of its curriculum to ensure alignment with public service training needs, and
- refined its costing and pricing strategy to inform the analysis of all direct, indirect and overhead costs attributable to individual components of complete product suites.
|
Strategic Outcome: Public servants have the common knowledge and the leadership and management competencies they require to fulfil their responsibilities in serving Canadians.
- Program: Foundational Learning
- Program: Organizational Leadership Development
- Program: Public Sector Management Innovation
|
Strengthening Curriculum |
| Market Share |
An increasing number of training options are available to learners, ranging from traditional in-class delivery models to online training providers. As part of the School's efforts to be the learning provider of choice for the public service, the School:
- implemented targeted client communications with monthly marketing notifications to build public service awareness of the School and its offerings;
- increased its use of social media tools to provide electronic updates regarding its product and services; and
- conducted a competitor analysis to confirm the relative stability of its market share related to public service learning activities.
|
Strategic Outcome: Public servants have the common knowledge and the leadership and management competencies they require to fulfil their responsibilities in serving Canadians.
- Program: Foundational Learning
- Program: Organizational Leadership Development
- Program: Public Sector Management Innovation
- Program: Internal Services
|
Building Partnerships |
| Adequate and Timely Capacity |
Rapidly changing technology, along with the expectations it creates among clients, remains a constant challenge for the School. The School's 2012-13 Report on Plans and Priorities identified technology as an opportunity to transform how the School delivers its learning services.
As part of these efforts, the School continued to develop the potential of the Integrated Learning Management System (I-LMS) to increase accessibility in support of public-service-wide learning in addition to developing a long-term plan for technology advancement for the organization.
As part of the commitments outlined in the 2012-13 Report on Plans and Priorities, the School strategically managed staffing and vacancies in response to fluctuating resource needs, as well as the human resources implications related to ceasing direct delivery of language training services to the public service. |
Strategic Outcome: Public servants have the common knowledge and the leadership and management competencies they require to fulfil their responsibilities in serving Canadians.
- Program: Foundational Learning
- Program: Organizational Leadership Development
- Program: Public Sector Management Innovation
- Program: Internal Services
|
Management of Change |
As a learning service provider for the public service, the School uses the revenues generated from client organizations to fund approximately half of the organization's total expenditures. In 2012-13, reductions in government expenditures and the size of the public service resulted in reductions in spending on training and a decrease in the
overall client base. These factors, combined with the end of direct delivery of language training, led to an overall reduced demand for the School's products and services.
The School operates in a dynamic environment with increasing client expectations to access learning in new and innovative ways, particularly through online and mobile devices. The consolidation of information technology services also requires that the School work closely with Shared Services Canada to ensure effective and responsive client service. The School's 2012-13 risk mitigation strategy and related action plans focused on the following priorities to ensure the
achievement of its strategic outcome:
- renewal of curriculum and learning approaches for courses and services to respond to client needs;
- implementation of a costing and pricing strategy to enable a rigorous analysis of the School's full suite of products and services and to guide effective decision making;
- an engagement strategy with client departments including targeted, proactive business development; and
- making sure human resource requirements are aligned to efficiently support program delivery.
In 2012-13, the risk mitigation strategy and action plans developed by the School resulted in the effective management of the risks outlined in its Corporate Risk Profile.
Summary of Performance
Financial Resources – Total Departmental ($ Thousands)
2012-13 Financial Resources - Total Departmental in thousands of dollars. Read down the first column for the Total Budgetary Expenditures (Main Estimates) and then to the right for the Planned Spending, Total Authorities (available for use), Actual Spending (authorities used) and the difference between Planned and Actual Spending.
Total Budgetary Expenditures
(Main Estimates)
2012-13 |
Planned Spending
2012-13 |
Total Authorities
(available for use)
2012-13 |
Actual Spending
(authorities used)
2012-13 |
Difference
(Planned vs. Actual Spending) |
| 101,096 |
101,096 |
135,012 |
97,265 |
(3,831) |
The School's planned spending represents the 2012-13 Main Estimates. The School's total authorities include appropriations, actual revenues generated in 2012-13 and unspent revenues generated in 2011-12 that were carried forward to 2012–13 pursuant to Section 18(2) of the CSPS Act.
Human Resources [Full-Time Equivalents (FTEs)]
2012-13 Human Resources for Full-Time Equivalents. Read down the first column for the Planned Full-Time Equivalents and then to the right for the Actual Full-Time Equivalents and the difference between Planned and Actual Full-Time Equivalents.
Planned
2012-13
|
Actual
2012-13 |
Difference
2012-13 |
| 744 |
691 |
-53 |
Performance Summary Table for Strategic Outcome and Programs ($ Thousands)
Strategic Outcome: Public servants have the common knowledge and the leadership and management
competencies they require to fulfil their responsibilities in serving Canadians.
Performance Summary Table for Strategic Outcome and Programs in thousands of dollars. Select one of the three programs from the first column and then read to the right for figures for the 2012-13 Total Budget Expenditures (Main Estimates); the Planned Spending for 2012-13, 2013-14 and 2014-15; the 2012-13 Total Authorities (available for use); and the Actual Spending (authorities used) for 2012-13, 2011-12, and 2010-11. The last column presents the Alignment to Government of Canada Outcome. The last row presents the Strategic Outcome sub-totals.
| Program |
Total
Budgetary
Expenditures
(Main
Estimates
2012-13) |
Planned Spending |
Total
Authorities
(available
for use)
2012-13 |
Actual Spending
(authorities used) |
Alignment
to Government
of Canada
Outcome |
| 2012-13 |
2013-14 |
2014-15 |
2012-13 |
2011-12 |
2010-11 |
Foundational
Learning |
65,398 |
65,398 |
55,958 |
54,409 |
89,637 |
48,892 |
74,699 |
72,488 |
Government
Affairs —
Well-managed and efficient
government
operationsFootnote viii |
Organizational
Leadership
Development |
11,101 |
11,101 |
10,546 |
10,254 |
13,727 |
8,482 |
12,713 |
17,993 |
Public Sector
Management
Innovation |
11,280 |
8,280 |
9,178 |
8,924 |
12,800 |
9,499 |
8,443 |
10,468 |
Strategic
Outcome
Sub-Total |
87,779 |
84,779 |
75,682 |
73,587 |
116,164 |
66,873 |
95,855 |
100,949 |
Performance Summary Table for Internal Services ($ Thousands)
Performance Summary Table for Internal Services in thousands of dollars. Figures are presented in the second row of the table; the first cell is blank though. The categories from left to right are: 2012-13 Total Budgetary Expenditures (Main Estimates), Planned Spending for 2012-13, 2013-14, and 2014-2015; the Total Authorities (available for use) for 2012-13 and the Actual Spending (authorities used) for 2012-13, 2011-12 and 2010-11. Sub-totals are presented in the last row of the table.
| Internal Services |
Total Budgetary Expenditures (Main Estimates 2012-13) |
Planned Spending |
Total Authorities (available for use)
2012-13 |
Actual Spending
(authorities used) |
| 2012-13 |
2013-14 |
2014-15 |
2012-13 |
2011-12 |
2010-11 |
| |
13,317 |
16,317 |
22,782 |
22,151 |
18,848 |
30,392 |
30,086 |
27,685 |
| Sub-Total |
13,317 |
16,317 |
22,782 |
22,151 |
18,848 |
30,392 |
30,086 |
27,685 |
Total Performance Summary Table ($ Thousands)
Total Performance Summary Table in thousands of dollars. Figures are presented in the second row of the table; the first cell is blank though. The categories from left to right are: 2012-13 Total Budgetary Expenditures (Main Estimates), Planned Spending for 2012-13, 2013-14 and 2014-15; 2012-13 Total Authorities (available for use) and Actual Spending (authorities used) for 2012-13, 2011-12 and 2010-11. Totals are presented in the last row of the table.
| Strategic Outcome and Internal Services |
Total Budgetary Expenditures (Main Estimates 2012-13) |
Planned Spending |
Total Authorities (available for use)
2012-13 |
Actual Spending
(authorities used) |
| 2012-13 |
2013-14 |
2014-15 |
2012-13 |
2011-12 |
2010-11 |
| |
101,096 |
101,096 |
98,464 |
95,738 |
135,012 |
97,265 |
125,941 |
128,634 |
| Total |
101,096 |
101,096 |
98,464 |
95,738 |
135,012 |
97,265 |
125,941 |
128,634 |
In 2012-13, the reduction in planned spending is a result of the School's comprehensive efforts to achieve efficiencies in a number of areas, including incorporating a more strategic and whole-of-government approach to its learning services, streamlining its internal operations and subsequently restructuring the organization. The reduction in actual spending is attributable to ceasing the direct delivery of language training and cost containment measures.
Expenditure Profile ($ Thousands)

Text version
A chart depicting Actual Spending in thousands of dollars for the Canada School of Public Service from 2010-11 to 2012-13 and Planned Spending from 2013-14 to 2015-16.
Actual Spending:
2010-11: $128,634
2011-12: $125,941
2012-13: $97,265
Planned Spending:
2013-14: $98,464
2014-15: $95,738
2015-16: $95,439
The School's actual spending decreased over the last three years as a result of the implementation of more
cost-efficient and streamlined solutions to the School's operations and learning services. Efforts in this area also
included the School ceasing the direct delivery of language training services.
Revenues ($ Thousands)

Text version
Revenues
A chart depicting the revenue trend for the Canada School of Public Service from 2009-10 to 2012-13. The figures for the four fiscal years are as follows:
2009-10: $70,000
2010-11: $71,695
2011-12: $72,405
2012-13: $46,792
The decrease in revenues in 2012-13 is attributable to the School no longer providing direct delivery of language training to the public service and reduced client demand for the School's products and services.
Estimates by Vote
For information on the Canada School of Public Service's organizational Votes and/or statutory expenditures, please see
the Public Accounts of Canada 2013 (Volume II).Footnote ix An electronic version of the Public Accounts of Canada
2013 is available on the Public Works and Government Services Canada's Web site.
Strategic Environmental Assessment
During 2012-13, the School considered the environmental effects of initiatives subject to the Cabinet Directive on the Environmental Assessment of Policy, Plan and Program ProposalsFootnote x and did not produce any public statements.
Section II: Analysis of Programs and Sub-Programs by Strategic Outcome
Strategic Outcome
The School has a single strategic outcome: "Public servants have the common knowledge and the leadership and management competencies they require to fulfil their responsibilities in serving Canadians." Four programs and nine sub-programs support this strategic outcome:
- Foundational Learning
- Required Training
- Professional Development
- Official Languages Learning
- Online Learning
- Organizational Leadership Development
- Leadership Competencies
- Leadership Development Programs
- Leadership Community Building
- Public Sector Management Innovation
- Organizational Learning Services
- Innovative Management Practices
- Internal Services
Strategic Outcome table. The first row displays the School's Strategic Outcome description. Read down the first column for the Performance Indicators and then to the right for the Targets and Actual Results.
| Strategic Outcome: Public servants have the common knowledge and the leadership and management competencies they require to fulfil their responsibilities in serving Canadians. |
| Performance Indicators |
Targets |
Actual Results |
| Number of learning activities that address leadership development, management competencies and common knowledge, and number of participants. |
Approximately 900 learning activities. Approximately 220,000 learner days (number of learners/participants multiplied by the number of days in training). |
In 2012-13, the School's product inventory consisted of more than 800 learning activities. Approximately 152,000 learner days were delivered. |
| Percentage of public service employees who, after attending School learning activities, feel that the training provided responded to their learning needs. |
80 percent of learning activity participants feel that the training provided responded to their needs. |
In 2012-13, 82 percent of respondents felt that the training provided met their learning needs. |
Over the course of the year, the School concentrated its efforts on supporting the Government of Canada's priority of public service-wide transformation by equipping public service employees with the common knowledge and skills required to modernize government operations while ensuring service excellence to Canadians. In response, the School's curriculum addressed a variety of relevant issues including business process transformation, leading change and workforce management.
At the same time, the School implemented internal efficiencies and took a more strategic and targeted approach to its learning products and services. While the School's operating budget and internal capacity was reduced, the School was able to continue providing relevant and high-quality learning services to the public service.
Programs and Sub-Programs
Foundational Learning Program
Through this program, the School contributes to building a professional workforce by providing foundational learning activities, which are aligned with public service management priorities and designed in accordance with Treasury Board's Policy on Learning, Training and Development and associated knowledge standards. Four sub-programs support this program:
- Required Training
- Professional Development Training
- Official Languages Learning
- Online Learning
Financial Resources – Foundational Learning Program ($ Thousands)
2012-13 Financial Resources - Foundational Learning Program in thousands of dollars. Read down the first column for the Total Budgetary Expenditures (Main Estimates) and then read to the right for the Planned Spending, Total Authorities (available for use), Actual Spending (authorities used) and the difference between Planned and Actual Spending.
Total Budgetary Expenditures
(Main Estimates)
2012-13 |
Planned Spending
2012-13 |
Total Authorities (available for use)
2012-13 |
Actual Spending (authorities used)
2012-13 |
Difference
2012-13 |
| 65,398 |
65,398 |
89,637 |
48,892 |
(16,506) |
Planned spending reflects Main Estimates, which included spending related to language training products. Actual spending, however, reflects the reductions associated with the decision to end direct delivery of language training to the public service.
Human Resources (FTEs) – Foundational Learning Program
2012-13 Human Resources (Full-Time Equivalents) - Foundational Learning Program. Read down the first column for the Planned Full-Time Equivalents and then to the right for the Actual Full-Time Equivalents and the difference between Planned and Actual Full-Time Equivalents.
Planned
2012-13 |
Actual
2012-13 |
Difference
2012-13 |
| 268 |
288 |
20 |
Performance Results – Foundational Learning Program
Performance Results - Foundational Learning Program. Read down the first column for the Expected Results and then to the right for the Performance Indicators, Targets and Actual Results.
| Expected Results |
Performance
Indicators |
Targets |
Actual Results |
| Public service employees' learning objectives are met through the foundational learning activities provided by the School. |
The School will identify the percentage of participants who report their learning objectives were met through the School's foundational learning activities. |
80 percent of respondents report that their learning objectives were met. |
In 2012-13, 88 percent of respondents felt that the training provided met their learning needs. |
Performance Analysis and Lessons Learned
As part of the School's efforts to better manage and strengthen its curriculum, a comprehensive review of the organization's learning products, market trends and emerging best practices was undertaken with the objective of remaining efficient, cost-effective and aligned to the Government of Canada's priorities and the learning needs of the public service.
In 2012-13, the School also explored opportunities to collaborate with the private sector and academia, as well as capitalize on the existing expertise within the public service, with a view to increasing effectiveness and realizing cost efficiencies in the design and delivery of its learning services.
As part of these efforts, the School strengthened its existing relationships with policy leads and human resources practitioners, including required training coordinators and Heads of Learning Forum, and sought new opportunities to work with other government departments and functional communities. In addition, the School worked with Regional Federal Councils to provide learning services on a variety of topics, including strategic change management and career transition. For example, the School collaborated with the Nova Scotia Federal Council to develop a talent management framework; an initiative designed to identify human resources needs and develop an accompanying strategic workforce implementation plan.
The School continued to expand its use of technology in support of "blended learning" where classroom learning is combined with virtual and long-distance delivery. This approach has led to more cost-effective delivery solutions and increased employees' access to the School's learning services across the country. For example, the School collaborated with the Nunavut Federal Council to design and deliver the Nunavut Learning Fair, an initiative tailored to meet the learning needs of public service employees working in remote locations.
In support of Canada's Action Plan on Open GovernmentFootnote xi and the new public service-wide transition to GCDOCS, a comprehensive information management and recordkeeping system, the School developed a
suite of learning products and services to facilitate the implementation of GCDOCS across the public service.
The School's I-LMS facilitates learning management within the public service, providing a common tool for learning delivery and e-content sharing. With the objective of seeking more efficient and cost-effective ways to deliver learning across the country, the School continued to examine the potential role of I-LMS as a shared resource across government.
Required Training Sub-program
The School, through its Required Training sub-program, ensures that public service employees meet required knowledge standards and supports public servants' accountability through the provision of training in values and ethics, governance and accountability.
Financial Resources – Required Training Sub-program ($ Thousands)
2012-13 Financial Resources - Required Training Sub-program in thousands of dollars. Read down the first column for the Planned Spending and then to the right for the Actual Spending and the difference between Planned and Actual Spending. A note appears below the table.
Planned Spending
2012-13 |
Actual Spending
2012-13 |
Difference
2012-13 |
| - |
5,232 |
- |
Note: The School's 2012-13 planned spending was prepared at the program level only.
Human Resources (FTEs) – Required Training Sub-program
2012-13 Human Resources (Full-Time Equivalents) - Required Training Sub-program. Read down the first column for the Planned Full-Time Equivalents and then to the right for the Actual Full-Time Equivalents and the difference between Planned and Actual Full-Time Equivalents. A note appears below the table.
Planned
2012-13 |
Actual
2012-13 |
Difference
2012-13 |
| - |
45 |
- |
Note: The School's 2012-13 planned human resources were prepared at the program level only.
Performance Results – Required Training Sub-program
Performance Results - Required Training Sub-program. Read down the first column for the Expected Results and then to the right for the Targets and Actual Results.
Expected
Results |
Performance
Indicators |
Targets |
Actual Results |
| Public service employees' learning objectives are met through required training activities provided by the School. |
Percentage of public service employees who report their learning objectives were met through the School's required training activities. |
80 percent of respondents report that their learning objectives were met. |
In 2012-13, 92 percent of respondents felt that the training provided met their learning needs. |
Performance Analysis and Lessons Learned
In accordance with the Treasury Board's Policy on Learning, Training and Development, the School's Orientation to the Public Service training provides a foundational understanding of government and the values, ethics and responsibilities that public service employees will draw upon throughout their careers.
Breakdown of Orientation to the Public Service Deliveries
Breakdown of Orientation to the Public Service Deliveries. Select a fiscal year from the first column (2007-08 to 2012-13) and then read to the right for the number of offerings and learners for courses delivered in the National Capital Region, the number of offerings and learners for courses delivered in the regions, and the total number of offerings and learners.
Fiscal
Year |
Courses Delivered in the
National Capital Region |
Courses Delivered
Regionally |
Total
Courses Delivered |
| Offerings |
Learners |
Offerings |
Learners |
Offerings |
Learners |
| 2007-08 |
40 |
4,804 |
22 |
2,456 |
62 |
7,260 |
| 2008-09 |
55 |
5,568 |
47 |
4,916 |
102 |
10,484 |
| 2009-10 |
44 |
4,935 |
44 |
4,188 |
88 |
9,123 |
| 2010-11 |
39 |
3,417 |
48 |
3,042 |
87 |
6,459 |
| 2011-12 |
38 |
2,455 |
37 |
1,928 |
75 |
4,383 |
| 2012-13 |
23 |
1,152 |
37 |
1,437 |
60 |
2,589 |
The School also provides Authority Delegation Training to five groups of employees (i.e. supervisors, managers, new executives, senior executives and assistant deputy ministers) to ensure that these groups are fully qualified to exercise their delegated authorities in human resources, finance, procurement and information management.
Breakdown of Authority Delegation Training Deliveries
Breakdown of Authority Delegation Training Deliveries. Select a fiscal year from the first column (2007-08 to 2012-13) and then read to the right for the number of offerings and learners for courses delivered in the National Capital Region, the number of offerings and learners for courses delivered in the regions, and the total number of offerings and learners.
Fiscal
Year |
Courses Delivered in the
National Capital Region |
Courses Delivered
Regionally |
Total
Courses Delivered |
| Offerings |
Learners |
Offerings |
Learners |
Offerings |
Learners |
| 2007-08 |
178 |
4,051 |
123 |
2,616 |
301 |
6,667 |
| 2008-09 |
234 |
5,259 |
138 |
2,931 |
372 |
8,190 |
| 2009-10 |
257 |
5,891 |
157 |
3,147 |
414 |
9,038 |
| 2010-11 |
272 |
5,764 |
170 |
3,174 |
442 |
8,938 |
| 2011-12 |
229 |
4,835 |
138 |
2,450 |
367 |
7,285 |
| 2012-13 |
157 |
3,233 |
123 |
1,981 |
280 |
5,214 |
In support of the Treasury Board's new Directive on Performance Management, which will take effect on
April 1, 2014, the School worked collaboratively with the Office of the Chief Human Resources Officer, the Privy
Council Office, the Treasury Board of Canada Secretariat and the Public Service Commission in developing a performance
management curriculum. This suite of online tools is comprised of mandatory training for public service
employees responsible for evaluating employee performance.
Building on its efforts from the past year, the School will continue to advance the Directive on Performance Management in collaboration with its central agency partners by developing learning tools to support related public service-wide competencies.
Professional Development Training Sub-program
Financial Resources – Professional Development Training Sub-program ($ Thousands)
2012-13 Financial Resources - Professional Development Training Sub-program in thousands of dollars. Read down the first column for the Planned Spending and then to the right for the Actual Spending and the difference between Planned and Actual Spending. A note appears below the table.
Planned Spending
2012-13 |
Actual Spending
2012-13 |
Difference
2012-13 |
| - |
25,365 |
- |
Note: The School's 2012-13 planned spending was prepared at the program level only.
Human Resources (FTEs) – Professional Development Training Sub-program
2012-13 Human Resources (Full-Time Equivalents) - Professional Development Training Sub-program. Read down the first column for the Planned Full-Time Equivalents and then to the right for the Actual Full-Time Equivalents and the difference between Planned and Actual Full-Time Equivalents. A note appears below the table.
Planned
2012-13 |
Actual
2012-13 |
Difference
2012-13 |
| - |
170 |
- |
Note: The School's 2012-13 planned human resources were prepared at the program level only.
Performance Results – Professional Development Training Sub-program
Performance Results - Professional Development Training Sub-program. Read down the first column for the Expected Results and then to the right for the Performance Indicators, Targets and Actual Results.
Expected
Results |
Performance
Indicators |
Targets |
Actual Results |
| Public service employees are satisfied with the training received in professional development areas. |
Degree of satisfaction of participants with the training provided in professional development areas. |
Learning activities receive an average rating of 4 on a 5-point scale. |
In 2012-13, professional development training activities received an overall satisfaction rating of 4.30 on a 5-point scale. |
| Public service employees' learning objectives are met in the area of professional development training at the School. |
Percentage of public service employees who report their learning objectives were met
through the School's professional development training activities. |
80 percent of respondents report that their learning objectives were met. |
In 2012-13, 87 percent of respondents felt that the training provided met their learning needs. |
Performance Analysis and Lessons Learned
The School designs and delivers learning products for all public service employees, including functional communities,Footnote xii in order to provide public service employees with the knowledge required to perform their
functions and assume their responsibilities under related legislation and policies.
Breakdown of Functional Community Deliveries
Breakdown of Functional Community Deliveries. Select a fiscal year from the first column (2007-08 to 2012-13) and then read to the right for the number of offerings and learners for courses delivered in the National Capital Region, the number of offerings and learners for courses delivered in the regions, and the total number of offerings and learners.
Fiscal
Year |
Courses Delivered in the
National Capital Region |
Courses Delivered
Regionally |
Total
Courses Delivered
|
| Offerings |
Learners |
Offerings |
Learners |
Offerings |
Learners |
| 2007-08 |
358 |
7,226 |
255 |
5,647 |
613 |
12,873 |
| 2008-09 |
458 |
9,222 |
256 |
4,177 |
714 |
13,399 |
| 2009-10 |
470 |
8,794 |
281 |
3,166 |
751 |
11,960 |
| 2010-11 |
472 |
9,361 |
254 |
3,284 |
726 |
12,645 |
| 2011-12 |
496 |
10,134 |
244 |
3,247 |
740 |
13,381 |
| 2012-13 |
665 |
12,109 |
360 |
4,448 |
1,025 |
16,557 |
The School collaborated with Public Safety Canada, the Royal Canadian Mounted Police, the Treasury Board of Canada Secretariat and the Privy Council Office to develop a new Federal Emergency Management curriculum to broaden access to standardized emergency management training for security specialists within the public service. The security curriculum includes a combination of classroom and online courses and learning events designed to build individual and organizational capacity in this specialized area. Over the last year, the School's ability to collaborate across departments and synergize the efforts of expert stakeholder communities has led to a more cost-effective and efficient approach to the design of high-quality learning products. Moving forward, this successful collaboration will serve as a best practice when exploring future opportunities to support whole-of-government solutions.
Breakdown of Professional Development Deliveries
Breakdown of Professional Development Deliveries. Select a fiscal year from the first column (2007-08 to 2012-13) and then read to the right for the number of offerings and learners for courses delivered in the National Capital Region, the number of offerings and learners for courses delivered in the regions, and the total number of offerings and learners.
Fiscal
Year |
Courses Delivered in the
National Capital Region |
Courses Delivered
Regionally |
Total
Courses Delivered
|
| Offerings |
Learners |
Offerings |
Learners |
Offerings |
Learners |
| 2007-08 |
305 |
6,262 |
198 |
2,792 |
503 |
9,054 |
| 2008-09 |
271 |
5,628 |
196 |
3,066 |
467 |
8,694 |
| 2009-10 |
375 |
7,686 |
261 |
3,843 |
636 |
11,529 |
| 2010-11 |
389 |
8,403 |
264 |
4,033 |
653 |
12,436 |
| 2011-12 |
507 |
10,738 |
301 |
4,382 |
808 |
15,120 |
| 2012-13 |
573 |
10,651 |
525 |
6,999 |
1,098 |
17,650 |
In 2012-13, the School collaborated with the Young Professionals' Networks from 11 different departments from across
the public service to design and deliver the 2013 Career Boot Camp. This collaborative initiative, with over 550 participants in attendance, provided new and young professionals with the opportunity to engage in peer learning, foster workplace innovation and network. The popularity of this event showcased the important role of networks, both in-person and virtual, in providing an efficient and effective way to share ideas on emerging trends and gain new and innovative insights from peers.
Official Languages Learning Sub-program
The School, through its Official Languages Learning sub-program, facilitates a coordinated approach to language training services for departments in addition to developing and offering online language tools which public service
employees can use to maintain proficiency in their second language.
Financial Resources – Official Languages Learning Sub-program ($ Thousands)
2012-13 Financial Resources - Official Languages Learning Sub-program in thousands of dollars. Read down the first column for the Planned Spending and then to the right for the Actual Spending and the difference between Planned and Actual Spending. A note appears below the table.
Planned Spending
2012-13 |
Actual Spending
2012-13 |
Difference
2012-13 |
| - |
17,485 |
- |
Note: The School's 2012-13 planned spending was prepared at the program level only.
Human Resources (FTEs) – Official Languages Learning Sub-program
2012-13 Human Resources (Full-Time Equivalents) - Official Languages Learning Sub-program. Read down the first column for the Planned Full-Time Equivalents and then to the right for the Actual Full-Time Equivalents and the difference between Planned and Actual Full-Time Equivalents. A note appears below the table.
Planned
2012-13 |
Actual
2012-13 |
Difference
2012-13 |
| - |
70 |
- |
Note: The School's 2012-13 planned human resources were prepared at the program level only.
Performance Results – Official Languages Learning Sub-program
Performance Results - Official Languages Learning Sub-program. Read down the first column for the Expected Results and then to the right for the Performance Indicators, Targets and Actual Results.
Expected
Results |
Performance
Indicators |
Targets |
Actual Results |
| Public service employees are successful in second official language testing following language training by the School. |
Success rate from official languages testing. |
90 percent success rate. |
In 2012-13, the School ceased the direct delivery of language training to the public service. |
| Public service employees are using the tools available to maintain their second official language. |
Number of public service employees who access the School's official languages acquisition and retention products and services. |
Increase of 10 percent from previous fiscal year. |
In 2012-13, the School experienced a decrease in the number of public service employees
accessing its official languages products and services. |
Performance Analysis and Lessons Learned
In 2012-13, the School ceased the direct delivery of language training and focused its activities on quality assurance and the development of online tools. This shift resulted in a more strategic focus on developing new learning methodologies; providing language learning plan services on a cost-recovery basis; supporting the availability of quality-assured external providers; and providing online learning products.
A decrease in the number of public service employees using the School's official language acquisition and retention products may be attributed to several factors, including no longer offering the direct delivery of language training and the streamlining of the public service.
Online Learning Sub-program
Through its Online Learning sub-program, the School makes learning more accessible and efficient. As with its classroom courses, online learning products are designed to enhance public service employees' knowledge, skills and competencies.
Financial Resources – Online Learning Sub-program ($ Thousands)
2012-13 Financial Resources - Online Learning Sub-program in thousands of dollars. Read down the first column for the Planned Spending and then to the right for the Actual Spending and the difference between Planned and Actual Spending. A note appears below the table.
Planned Spending
2012-13 |
Actual Spending
2012-13 |
Difference
2012-13 |
| - |
810 |
- |
Note: The School's 2012-13 planned spending was prepared at the program level only.
Human Resources (FTEs) – Online Learning Sub-program
2012-13 Human Resources (Full-Time Equivalents) - Online Learning Sub-program. Read down the first column for the Planned Full-Time Equivalents and then to the right for the Actual Full-Time Equivalents and the difference between Planned and Actual Full-Time Equivalents. A note appears below the table.
Planned
2012-13 |
Actual
2012-13 |
Difference
2012-13 |
| - |
3 |
- |
Note: The School's 2012-13 planned human resources were prepared at the program level only.
Performance Results – Online Learning Sub-program
Performance Results - Online Learning Sub-program. Read down the first column for the Expected Results and then to the right for the Performance Indicators, Targets and Actual Results.
Expected
Results |
Performance
Indicators |
Targets |
Actual Results |
| Public service employees' learning objectives are met through the School's online learning activities. |
Percentage of public service employees who report their learning objectives were met through the School's online learning activities. |
80 percent of respondents report that their learning objectives were met. |
Unable to assess. |
| Needs of diversified learners are better met through more flexible learning environments. |
Number of online courses and blended learning courses. |
700 |
In 2012-13, over 5,000Footnote 2 online courses were made available to learners. |
Performance Analysis and Lessons Learned
New and innovative technology, including social media tools, has the potential to transform the way the public service operates and delivers services. In 2012-13, the School continued to leverage technology, increasing the use of virtual learning webcasts, webinars and video conferencing in an effort to offer more responsive and cost-effective delivery of learning. For example, the Quebec and Nunavut Region developed interactive learning modules designed to be accessed through mobile devices as part of its efforts to respond to learning needs and increase engagement with public service employees located in remote areas of the country.
In a time of transformation and changing demographics across government, the School undertook a number of
initiatives to support public service employees. Efforts included the expansion of the School's agreement with Public
Works and Government Services Canada's Pension Centre to deliver a new course via webcast. As a result,
public service employees were provided with a more concise and accessible product in response to increased demand.
Over the course of the year, harnessing the capabilities and flexibility of technology has proven to be an
effective and cost-efficient method to maximize the School's ability to deliver its learning services across the public
service, including more remote areas of the country.
Organizational Leadership Development Program
The School, through its Organizational Leadership Development program, strengthens public service leadership capacity and contributes to public service renewal by supporting existing and emerging leaders with targeted leadership learning activities, seminars and events. Three sub-programs support this program:
- Leadership Competencies
- Leadership Development Programs
- Leadership Community Building
Financial Resources – Organizational Leadership Development Program ($ Thousands)
2012-13 Financial Resources - Organizational Leadership Development Program in thousands of dollars. Read down the first column for the Total Budgetary Expenditures (Main Estimates) and then to the right for the Planned Spending, Total Authorities (available for use), Actual Spending (authorities used) and the difference between Planned and Actual Spending.
Total Budgetary Expenditures
(Main Estimates)
2012-13 |
Planned Spending
2012-13 |
Total Authorities (available for use)
2012-13 |
Actual Spending (authorities used)
2012-13 |
Difference
2012-13 |
| 11,101 |
11,101 |
13,727 |
8,482 |
(2,619) |
Human Resources (FTEs) – Organizational Leadership Development Program
2012-13 Human Resources (Full-Time Equivalents) - Organizational Leadership Development Program. Read down the first column for the Planned Full-Time Equivalents and then to the right for the Actual Full-Time Equivalents and the difference between Planned and Actual Full-Time Equivalents.
Planned
2012-13 |
Actual
2012-13 |
Difference
2012-13 |
| 102 |
60 |
-42 |
Performance Results – Organizational Leadership Development Program
Performance Results - Organizational Leadership Development Program. Read down the first column for the Expected Results and then to the right for the Performance Indicators, Targets and Actual Results.
Expected
Results |
Performance
Indicators |
Targets |
Actual Results |
| Public service managers, executives and senior leaders are satisfied with the leadership
development courses, programs and activities received. |
The School will measure the degree of satisfaction of public service employees with the leadership activities provided. |
Leadership activities receive an average rating of 4 on a 5-point scale on overall satisfaction. |
In 2012-13, leadership activities received an overall satisfaction rating of 4.55 on a 5-point scale. |
| Public service managers, executives and senior leaders are able to apply their leadership competencies in the workplace. |
The School will determine the percentage of public service managers, executives and senior leaders who intend to apply the knowledge acquired through leadership development activities in their workplace. |
80 percent of participants are able to apply their acquired knowledge. |
In 2012-13, 95 percent of respondents felt confident in their ability to apply the training on the job. |
Performance Analysis and Lessons Learned
Due to the significant focus on leadership accountabilities and the anticipated high retirement rates among employees and executives, there is continuous demand for programs that prepare leaders. Learning and professional development are essential to building the capacity required to lead a high-performing public service.
In 2012-13, the School took a more targeted approach to its leadership learning programs and aligned its internal capacity accordingly. For example, the School re-designed its leadership development curriculum in areas such as leading change, innovation and performance management.
Breakdown of Leadership Program Deliveries
Breakdown of Leadership Program Deliveries. Select a fiscal year from the first column (2007-08 to 2012-13) and then read to the right for the number of offerings and learners for courses delivered in the National Capital Region, the number of offerings and learners for courses delivered in the regions, and the total number of offerings and learners.
Fiscal
Year |
Courses Delivered in the
National Capital Region |
Courses Delivered
Regionally |
Total
Courses Delivered
|
| Offerings |
Learners |
Offerings |
Learners |
Offerings |
Learners |
| 2007-08 |
145 |
2,051 |
13 |
166 |
158 |
2,217 |
| 2008-09 |
103 |
2,666 |
38 |
182 |
141 |
2,848 |
| 2009-10 |
170 |
3,027 |
35 |
148 |
205 |
3,175 |
| 2010-11 |
140 |
2,483 |
23 |
377 |
163 |
2,860 |
| 2011-12 |
98 |
1,561 |
23 |
371 |
121 |
1,932 |
| 2012-13 |
140 |
2,153 |
67 |
980 |
207 |
3,133 |
Over the course of the year, the School continued to respond to the change management learning needs of executives and managers at all levels in order to equip them with the knowledge and skills necessary to strategically manage transformation within their departments. In 2012-13, the School expanded its 12-month ileadership program to provide foundational leadership skills and prepare participants for a complex and rapidly changing environment. The curriculum incorporates practical and innovative learning solutions, including cutting-edge tools such as case studies, simulations, self-assessment instruments and action learning groups.
The School also leveraged opportunities to expand its reach in offering its ileadership program to various levels of government. In doing so, the School was able to meet the needs of organizations while providing a solution that was efficient and cost-effective for all parties. Further, incorporating more targeted methods and a collaborative approach to delivering learning has proven to be an effective way to remain responsive to departments in a time of transition.
Leadership Competencies Sub-program
The School, through its Leadership Competencies sub-program, ensures that current and future leaders in the public
service are equipped with the leadership competencies required to deliver results and lead change within their departments.
Financial Resources – Leadership Competencies Sub-program ($ Thousands)
2012-13 Financial Resources - Leadership Competencies Sub-program in thousands of dollars. Read down the first column for the Planned Spending and then to the right for the Actual Spending and the difference between Planned and Actual Spending. A note appears below the table.
Planned Spending
2012-13 |
Actual Spending
2012-13 |
Difference
2012-13 |
| - |
2,056 |
- |
Note: The School's 2012-13 planned spending was prepared at the program level only.
Human Resources (FTEs) – Leadership Competencies Sub-program
2012-13 Human Resources (Full-Time Equivalents) - Leadership Competencies Sub-program. Read down the first column for the Planned Full-Time Equivalents and then to the right for the Actual Full-Time Equivalents and the difference between Planned and Actual Full-Time Equivalents. A note appears below the table.
Planned
2012-13 |
Actual
2012-13 |
Difference
2012-13 |
| - |
15 |
- |
Note: The School's 2012-13 planned human resources were prepared at the program level only.
Performance Results – Leadership Competencies Sub-program
Performance Results - Leadership Competencies Sub-program. Read down the first column for the Expected Results and then to the right for the Performance Indicators, Targets and Actual Results.
Expected
Results |
Performance
Indicators |
Targets |
Actual Results |
| Public service managers, executives and senior leaders are satisfied with the leadership
foundations training received. |
Degree of satisfaction of participants with the leadership foundations training provided. |
Learning activities receive an average satisfaction rating of 4 on a 5-point scale. |
In 2012-13, the leadership competencies training activities received a satisfaction rating of 4.50 on a 5-point scale. |
| Public service managers', executives' and senior leaders' learning objectives are met through the School's leadership competency courses. |
Percentage of public service managers, executives and senior leaders who report their learning objectives were met through the School's leadership competency courses. |
80 percent of respondents report that their learning objectives were met. |
In 2012-13, 92 percent of respondents felt that the training provided met their learning needs. |
| Public service managers, executives and senior leaders intend to and/or are able to apply the knowledge acquired through the School's leadership competency courses. |
Percentage of public service managers, executives and senior leaders who intend to and/or are able to apply the knowledge acquired through the School's leadership competency courses. |
80 percent of participants are able to apply their acquired knowledge. |
In 2012-13, 95 percent of respondents felt confident in their ability to apply the leadership competencies training on the job. |
Performance Analysis and Lessons Learned
The School continued to support deputy heads with high-quality, relevant and cost-effective learning solutions in support of a high-performing public service. Building on these efforts, the School successfully piloted its new Management Suite for New Executives, a comprehensive set of courses designed using a modular approach, on a variety of topics including financial management, performance management and other key leadership competencies.
In 2012-13, the School also re-designed its Living Leadership: The Executive Excellence Program, offering more flexible and targeted learning solutions while maintaining a focus on the importance of experiential learning.
Leadership Development Programs Sub-program
The School, through its Leadership Development Programs sub-program, supports succession planning and renewal
within departments and across the public service by providing comprehensive and relevant leadership development products and services.
Financial Resources – Leadership Development Programs Sub-program ($ Thousands)
2012-13 Financial Resources - Leadership Development Programs Sub-program in thousands of dollars. Read down the first column for the Planned Spending and then to the right for the Actual Spending and the difference between Planned and Actual Spending. A note appears below the table.
Planned Spending
2012-13 |
Actual Spending
2012-13 |
Difference
2012-13 |
| - |
6,103 |
- |
Note: The School's 2012-13 planned spending was prepared at the program level only.
Human Resources (FTEs) – Leadership Development Programs Sub-program
2012-13 Human Resources (Full-Time Equivalents) - Leadership Development Programs Sub-program. Read down the first column for the Planned Full-Time Equivalents and then to the right for the Actual Full-Time Equivalents and the difference between Planned and Actual Full-Time Equivalents. A note appears below the table.
Planned
2012-13 |
Actual
2012-13 |
Difference
2012-13 |
| - |
43 |
- |
Note: The School's 2012-13 planned human resources were prepared at the program level only.
Performance Results – Leadership Development Programs Sub-program
Performance Results - Leadership Development Programs Sub-program. Read down the first column for the Expected Results and then to the right for the Performance Indicators, Targets and Actual Results.
Expected
Results |
Performance
Indicators |
Targets |
Actual Results |
| Satisfaction with the leadership development programs provided by the School for first time supervisors, managers, executives and senior leaders. |
Degree of satisfaction of first time supervisors, managers, executives and senior leaders with the leadership development programs provided by the School. |
Learning activities receive an average overall satisfaction rating of 4 on a 5-point scale. |
In 2012-13, leadership development program activities received an overall satisfaction rating of
4.62 on a 5-point scale. |
| Public service managers', executives' and senior leaders' learning objectives are met through leadership development programs at the School. |
Percentage of public service managers, executives and senior leaders who report their learning objectives were met through leadership development programs at the School. |
80 percent of respondents report that their learning objectives were met. |
In 2012-13, 96 percent of respondents reported that the training provided met their learning needs. |
Performance Analysis and Lessons Learned
In 2012-13, the School focused on offering efficient and cost-effective learning solutions to executives across the public service and on incorporating more thematic, just-in-time modules. As part of these efforts, the School eliminated its Advanced Leadership Program.
In 2012-13, the School designed a new service excellence suite of learning products to equip leaders with the knowledge to promote service excellence and service transformation within their organizations and across the public service. In developing this curriculum, the School worked with Service Canada and the Institute for Citizen-Centered Service, a successful collaboration that will be built upon in the future.
The School also developed a new leadership training program, ConnEXion: Senior Leaders for Tomorrow, designed to provide a customized curriculum to meet participants' leadership learning needs. This approach also serves to provide leaders with peer-learning opportunities to discuss current and emerging issues, build networks and share best practices.
The School continued to offer change management support to departments with a view to building organizational capacity in the strategic management of change and transformation. Over the course of the year, the School's "blended learning" approach proved to be valuable in remaining agile, efficient and cost-effective in responding to the new and emerging learning needs across the public service.
Leadership Community Building Sub-program
The School, through its Leadership Community Building sub-program, supports public service leaders through the School's networking and engagement activities, which are designed to address current trends, best practices and emerging issues of strategic importance to the public service.
Financial Resources – Leadership Community Building Sub-program ($ Thousands)
2012-13 Financial Resources - Leadership Community Building Sub-program in thousands of dollars. Read down the first column for the Planned Spending and then to the right for the Actual Spending and the difference between Planned and Actual Spending. A note appears below the table.
Planned Spending
2012-13 |
Actual Spending
2012-13 |
Difference
2012-13 |
| - |
323 |
- |
Note: The School's 2012-13 planned spending was prepared at the program level only.
Human Resources (FTEs) – Leadership Community Building Sub-program
2012-13 Human Resources (Full-Time Equivalents) - Leadership Community Building Sub-program. Read down the first column for the Planned Full-Time Equivalents and then to the right for the Actual Full-Time Equivalents and the difference between Planned and Actual Full-Time Equivalents. A note appears below the table.
Planned
2012-13 |
Actual
2012-13 |
Difference
2012-13 |
| - |
2 |
- |
Note: The School's 2012-13 planned human resources were prepared at the program level only.
Performance Results – Leadership Community Building Sub-program
Performance Results - Leadership Community Building Sub-program. Read down the first column for the Expected Results and then to the right for the Performance Indicators, Targets and Actual Results.
Expected
Results |
Performance
Indicators |
Targets |
Actual Results |
| Public service senior leaders are satisfied with the leadership community building activities provided by the School. |
The School will measure the degree of satisfaction of participants with the leadership
community building activities provided by the School. |
Learning activities receive an average overall satisfaction rating of 4 on a 5-point scale. |
Unable to assess. |
Performance Analysis and Lessons Learned
The School's Assistant Deputy Minister (ADM) Forum, an annual event that contributes to building a dynamic ADM community, continues to be a key opportunity for senior leaders of the public service to generate ideas that will shape how the public service operates and identify key trends and issues to be managed now and in the future. The 2012 ADM Forum, attended by over 300 participants, featured Wayne G. Wouters, Clerk of the Privy Council and Secretary to the Cabinet, and Janice Charette, Associate Secretary to the Cabinet and Deputy Minister of Intergovernmental Affairs, Privy Council Office.
The School hosted its second Learning Agora in May 2012, bringing together more than 50 key public service stakeholders involved in leadership, training and talent management. This event provided a forum to solicit feedback on the School's learning services and exchange ideas on topics related to learning and development in the public service. This event was a key deliverable for the School's Service Excellence Strategy and supported the School's client consultation activities.
Public Sector Management Innovation Program
The School, through its Public Sector Management Innovation program, enhances the performance and effectiveness of the public service by providing organizations with advisory services related to change management and innovation in public
sector management. Two sub-programs support this program:
- Organizational Learning Services
- Innovative Management Practices
Financial Resources – Public Sector Management Innovation Program ($ Thousands)
2012-13 Financial Resources - Public Sector Management Innovation Program in thousands of dollars. Read down the first column for the Total Budgetary Expenditures (Main Estimates) and then to the right for the Planned Spending, Total Authorities (available for use), Actual Spending (authorities used) and the difference between Planned and Actual Spending.
Total Budgetary Expenditures (Main Estimates)
2012-13 |
Planned Spending
2012-13 |
Total Authorities (available for use)
2012-13 |
Actual Spending (authorities used)
2012-13 |
Difference
2012-13 |
| 11,280 |
8,280 |
12,800 |
9,499 |
1,219 |
Human Resources (FTEs) – Public Sector Management Innovation Program
2012-13 Human Resources (Full-Time Equivalents) - Public Sector Management Innovation Program. Read down the first column for the Planned Full-Time Equivalents and then to the right for the Actual Full-Time Equivalents and the difference between Planned and Actual Full-Time Equivalents.
Planned
2012-13 |
Actual
2012-13 |
Difference
2012-13 |
| 77 |
62 |
-15 |
Performance Results – Public Sector Management Innovation Program
Performance Results - Public Sector Management Innovation Program. Read down the first column for the Expected Results and then to the right for the Performance Indicators, Targets and Actual Results.
Expected
Results |
Performance
Indicators |
Targets |
Actual Results |
| Public service organizations have access to tools and services to help them integrate learning, manage change and innovate. |
The School will track the number of organizations provided with Public Sector Management
Innovation advisory services. |
30 departments and agencies provided with Public Sector Management Innovation advisory services. |
In 2012-13, the School provided advisory services to 38 government departments and agencies. |
| Public service organizations integrate learning and innovate by adapting best
practices. |
The School will measure the degree of satisfaction of public service organizations with the School's Public Sector Management Innovation advisory services. |
A satisfaction rate of 80 percent. |
Unable to assess. |
Performance Analysis and Lessons Learned
In support of the Government of Canada's priority of modernizing government operations, the School mobilized public service-wide training, working closely with its central agency partners to support departments in navigating change and managing comprehensive transformation. Under this initiative, the School delivered offerings to more than 100 departments and 15,000 public service employees.
As part of ongoing consultation efforts, the School continued to directly engage with senior leaders across the public service in order to identify departmental learning needs and translate these into innovative learning solutions on timely topics such as the strategic management of change and leading in a time of transition.
In 2012-13, the School hosted its annual Manion Lecture, which aims to broaden public service employees' perspectives, encourage thoughtful debate on key issues and provide an opportunity to network. With more than 500 executives and leaders from Canadian universities and the federal government in attendance, the Honourable John Berry, Director of the United States Office of Personnel Management, shared his insights regarding the relevant and timely topic of public service innovation in times of transformation. This event sought to inspire participants to generate new and innovative ways to maximize organizational performance.
Organizational Learning Services Sub-program
The School, through its Organizational Learning Services sub-program, provides public service organizations with support to develop departmental learning strategies that are aligned with government-wide priorities while ensuring that individual learning needs are optimally addressed with a view to improving performance.
Financial Resources – Organizational Learning Services Sub-program ($ Thousands)
2012-13 Financial Resources - Organizational Learning Services Sub-program in thousands of dollars. Read down the first column for the Planned Spending and then to the right for the Actual Spending and the difference between Planned and Actual Spending. A note appears below the table.
Planned Spending
2012-13 |
Actual Spending
2012-13 |
Difference
2012-13 |
| - |
4,253 |
- |
Note: The School's 2012-13 planned spending was prepared at the program level only.
Human Resources (FTEs) – Organizational Learning Services Sub-program
2012-13 Human Resources (Full-Time Equivalents) - Organizational Learning Services Sub-program. Read down the first column for the Planned Full-Time Equivalents and then to the right for the Actual Full-Time Equivalents and the difference between Planned and Actual Full-Time Equivalents. A note appears below the table.
Planned
2012-13 |
Actual
2012-13 |
Difference
2012-13 |
| - |
28 |
- |
Note: The School's 2012-13 planned human resources were prepared at the program level only.
Performance Results – Organizational Learning Services Sub-program
Performance Results - Organizational Learning Services Sub-program. Read down the first column for the Expected Results and then to the right for the Performance Indicators, Targets and Actual Results.
Expected
Results |
Performance
Indicators |
Targets |
Actual Results |
| Public service organizations are satisfied with the School's change management services. |
Degree of satisfaction of public service organizations with the School's change management services. |
80 percent satisfaction rate. |
Unable to assess. |
| Public service organizations share best practices in learning and leverage their investment in areas of shared learning needs. |
Number of interdepartmental committees supported by the School. |
6 committees supported by the School. |
Unable to assess. |
| The School is meeting the learning needs of departments and agencies to achieve their organizational objectives. |
Client department feedback through the annual Learning Needs Analysis with a sample of departments confirms the School's programming is meeting department needs. |
Increase from previous fiscal year. |
Unable to assess. |
Performance Analysis and Lessons Learned
In 2012-13, the School played a role in supporting federal organizations in their efforts to manage transformative change. For example, the School offered its career transition resources in support of the Office of the Chief Human Resources Officer's Interdepartmental Career Community of Practice activities aimed at public service employees looking to re-orient their careers. As part of these efforts, the School renewed a number of collaborative arrangements with departments in an effort to increase accessibility to its learning resources and broaden its reach to those undergoing career transition.
Innovative Management Practices Sub-program
The School, through its Innovative Management Practices sub-program, enhances the School's curriculum through research activities, dialogue and the development of collaborative arrangements with the academic sector on issues related to public sector management.
Financial Resources – Innovative Management Practices Sub-program ($ Thousands)
2012-13 Financial Resources - Innovative Management Practices Sub-program in thousands of dollars. Read down the first column for the Planned Spending and then to the right for the Actual Spending and the difference between Planned and Actual Spending. A note appears below the table.
Planned Spending
2012-13 |
Actual Spending
2012-13 |
Difference
2012-13 |
| - |
5,246 |
- |
Note: The School's 2012-13 planned spending was prepared at the program level only.
Human Resources (FTEs) – Innovative Management Practices Sub-program
2012-13 Human Resources (Full-Time Equivalents) - Innovative Management Practices Sub-program. Read down the first column for the Planned Full-Time Equivalents and then to the right for the Actual Full-Time Equivalents and the difference between Planned and Actual Full-Time Equivalents. A note appears below the table.
Planned
2012-13 |
Actual
2012-13 |
Difference
2012-13 |
| - |
34 |
- |
Note: The School's 2012-13 planned human resources were prepared at the program level only.
Performance Results – Innovative Management Practices Sub-program
: Performance Results - Innovative Management Practices Sub-program. Read down the first column for the Expected Results and then to the right for the Performance Indicators, Targets and Actual Results.
Expected
Results |
Performance
Indicators |
Targets |
Actual Results |
| Public service organizations are satisfied with the School's Innovative Management Practices tools and services. |
Degree of satisfaction of public service organizations with the School's Innovative Management Practices tools and services. |
80 percent satisfaction rate. |
Unable to assess. |
Performance Analysis and Lessons Learned
In 2012-13, the School undertook a whole-of-government approach to supporting a modernized workplace, including harnessing new opportunities to collaborate and share resources, leveraging the use of technology to enhance networking and providing a variety of forums to discuss current and emerging issues and share promising practices.
In support of public service engagement and innovation, the School hosted 22 Armchair Discussions, available to all public service employees via webcast, on a variety of timely issues, including organizational change, innovation and engagement, workforce adjustment, career development and leadership. Over the course of the year, events of this nature provided a learning forum for public service employees and an opportunity for participants to connect with experts from across the public service.
Internal Services
Internal Services are groups of related activities and resources that are administered to support the needs of programs and other corporate obligations of an organization.Footnote 3 Internal Services include only those activities and resources that apply across an organization and not to those provided specifically to a program.
Financial Resources – Internal Services ($ Thousands)
2012-13 Financial Resources - Internal Services in thousands of dollars. Read down the first column for the Total Budgetary Expenditures (Main Estimates) and then to the right for the Planned Spending, Total Authorities (available for use), Actual Spending (authorities used) and the difference between Planned and Actual Spending.
Total Budgetary Expenditures (Main Estimates)
2012-13 |
Planned Spending
2012-13 |
Total Authorities (available for use)
2012-13 |
Actual Spending (authorities used)
2012-13 |
Difference
2012-13 |
| 13,317 |
16,317 |
18,848 |
30,392 |
14,075 |
The planned spending for Internal Services represents the amount in the 2012-13 Main Estimates. Actual spending represents funding allocated in the Main Estimates and unspent revenues generated in previous years that were carried
forward to 2012-13 pursuant to Section 18(2) of the CSPS Act.
Human Resources (FTEs) – Internal Services
2012-13 Human Resources (Full-time Equivalents) - Internal Services. Read down the first column for the Planned Full-Time Equivalents and then to the right for the Actual Full-Time Equivalents and the difference between Planned and Actual Full-Time Equivalents.
Planned
2012-13 |
Actual
2012-13 |
Difference
2012-13 |
| 297 |
281 |
-16 |
Performance Analysis and Lessons Learned
Following the arrival of a new Deputy Minister/President in October 2012, the School laid the foundation for a comprehensive review of its strategic directions. This project will result in a five-year strategic plan for the organization, which will entail outlining priority directions for the School's curriculum, the delivery and management of learning and the supporting infrastructure required for the effective and efficient design and delivery of learning.
In support of the Government of Canada's Common Human Resources Business Process,Footnote xiii the School established a client service working group comprised of managers and human resources professionals as part of its efforts to align its human resources services with a client service approach.
The School conducted a comprehensive review of its products and services and associated operational costs in order to inform strategic decision making and promote the School as a valuable strategic investment for departments. Efforts in this area included exploring new ways to leverage technology and social media to deliver learning and seeking ways to capitalize on the resources of other learning institutions through a brokered and partnered approach.
The School's Service Excellence Strategy was advanced in a number of key areas, including client service experience, client service culture and client service engagement. The School's Service Excellence Working Group, with representation from across the organization, led efforts to deliver on the strategy, including building on existing best service practices and promoting the application of a "service lens" approach to all of the School's products, services and collaborative activities.
As part of the School's faculty management activities, the organization worked to build its instructor capacity by leveraging existing knowledge and expertise within the School and across departments. In 2012-13, the School undertook collaborative arrangements with 28 departments in order to provide a sustainable and cost-effective way to meet the learning needs of the public service.
Section III: Supplementary Information
Financial Statements Highlights
Condensed Statement of Operations and Departmental Net Financial Position in thousands of dollars. Figures are presented starting at the third row of the table. The first column lists the following categories: Total expenses, Total revenues, Net cost of operations before government funding and transfers and Departmental net financial position. For each category, read to the right for the 2012-13 Planned Results, 2012-13 Actual, 2011-12 Actual, the dollar change between the 2012-13 Planned and the 2012-13 Actual and the dollar change between the 2012-13 Actual and the 2011-12 Actual. A note appears below the table.
Canada School of Public Service
Condensed Statement of Operations and Departmental Net Financial Position (Unaudited)
For the Year Ended March 31, 2013
($ Thousands) |
| blank |
2012-13
Planned ResultsFootnote * |
2012-13
Actual |
2011-12
Actual |
$ Change
(2012-13
Planned vs.
Actual) |
$ Change
(2012-13
Actual vs.
2011-12 Actual) |
| Total expenses |
120,260 |
110,859 |
132,970 |
9,401 |
(22,111) |
| Total revenues |
50,000 |
46,792 |
72,405 |
3,208 |
(25,613) |
| Net cost of operations before government funding and transfers |
70,260 |
64,067 |
60,565 |
6,193 |
3,502 |
| Departmental net financial position |
- |
(4,266) |
(6,202) |
- |
1,936 |
Actual expenditures have declined due to the implementation of the School's efficiency measures and ceasing the direct delivery of language training. Revenues have declined due to the elimination of direct delivery of language training and reduced client demand for the School's products and services.
Condensed Statement of Financial Position
Condensed Statement of Financial Position in thousands of dollars. Figures are presented starting at the third row of the table. The first column lists the following categories: Total net liabilities, Total net financial assets, Departmental net debt, Total non-financial assets and Departmental net financial position. For each category, read to the right for the figures for 2012-13 and 2011-12 and the dollar change between the two fiscal years.
Canada School of Public Service
Condensed Statement of Financial Position (Unaudited)
As at March 31, 2013
($ Thousands) |
| blank |
2012-13 |
2011-12 |
$ Change |
| Total net liabilities |
16,158 |
21,632 |
(5,474) |
| Total net financial assets |
8,001 |
10,853 |
(2,852) |
| Departmental net debt |
8,157 |
10,779 |
(2,622) |
| Total non-financial assets |
3,891 |
4,577 |
(686) |
| Departmental net financial position |
(4,266) |
(6,202) |
1,936 |
Total liabilities declined in 2012-13 primarily due to reductions in operating expenditures, which in turn, resulted in an improvement to the departmental net financial position.
Financial Highlights – Graphs
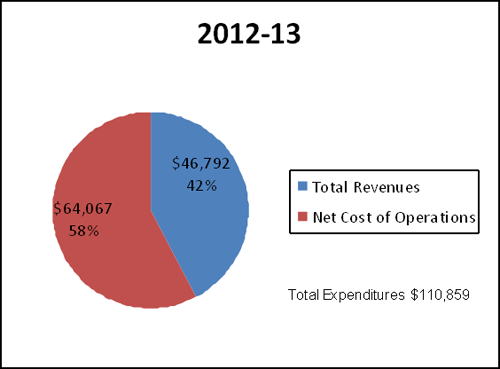
Text version
Pie chart illustrating the financial highlights for 2012–13.
Amounts are indicated in thousands of dollars. The chart is divided in two sections.
The first section represents the net cost of operations ($64,067 or 58 percent) and the second section represents the total revenues ($46,792 or 42 percent).
The total expenditures were $110,859.
Financial Statements
The financial highlights presented within the Departmental Performance Report are intended to serve as a general overview of the School's financial position. More information is available on the School's Web site More info for the financial highlights.Footnote xiv
Supplementary Information Tables
All electronic supplementary information tables listed in the 2012-13 Departmental Performance Report can be found on the School's Web site.Footnote xv
Tax Expenditures and Evaluations Report
The tax system can be used to achieve public policy objectives through the application of special measures such as low tax rates, exemptions, deductions, deferrals and credits. The Department of Finance publishes cost estimates and projections for these measures annually in the Tax Expenditures and Evaluations publication.Footnote xvi The tax measures presented in the Tax Expenditures and Evaluations publication are the sole responsibility of the Minister of Finance.
Section IV: Other Items of Interest
Organizational Contact Information
373 Sussex Drive
Ottawa, Ontario K1N 6Z2
Canada
Telephone: 1-866-703-9598
Fax: 1-866-944-0454
E-mail: info@csps-efpc.gc.ca
Web site: www.myschool-monecole.gc.ca
Additional Information
ISSN: SC100-6/2013E-PDF
Catalogue: 2290-7513
- Date modified:
